To the moon?
We all have been exposed to the "get rich quick schemes" in the social medias, and luckily I don't bite those lures. But I have wanted to learn about the stock market for some time.
DISCLAIMER:
Do NOT buy stocks because they passed the tests of this program. It's purpose is just to lower the amount of stocks i have to check manually before I decide if I want to purchase them.
After I bought my first stock, and the second one. I learned that I knew nothing, nothing near enough to use my hard earned cash on. Time to do some research! After consuming hours of material on Youtube and reading online. I figured that Mark Minervini had the strategy i was after. Richard Moglen on Youtube quickly became my favourite on Youtube, both with his private channel and his Trader Lion channel.
Richard Moglen has some good videos in his "Python for finance" playlist. And amongst those, a video of how to do Mark Minervini's trend template in python. And that i figured would make a good idea for a script to make. With the help of his and Algovibes videos i created my own script, dockerized it and set it up as a CronJob in my kubernetes cluster.
The script runs daily, when Yahoo finance has the closing prices of Oslo stock exchange. First it pulls the stocks listed, from Euronext and stores them in a pandas dataframe. Then it gathers the index value of OSEBEX so i can calculate relative strength. When i have that info the main part is up.
For every stock in the stocklist i check them against Mark Minervinis trend template, and if they pass the test i run more tests. I have tests to see if it made a new 20-day high, if it is out of bollinger bands, if it breaks through a pivot, and finally a test to check if it starts to climb or decline according to MACD indicator.
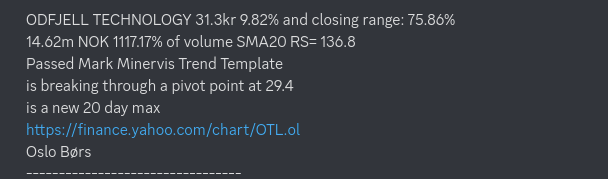
All of this is reported to my through discord webhook to my discord server. And i get information served like this posts header image, with the template:
Stock name, price, percent-change, closing range
total price traded, percent of 20-day moving average of volume, relative strength vs OSEBEX.
And then which indicators it passes, and a link to yahoo chart.
Feel free to fork it into your own, it should be fairly easy to provide your own stocklist instead of my Oslo list. You can run it with or without discord and separate DB. To just run it without separate DB and discord
docker run enzanto/stockfinder:latest
The code can be found at https://github.com/enzanto/stockfinder


Comments ()